Chapter 6 · complete English translation
Results
S. 114–137 – Results of the Map Networks
Chapter 6: Results
- Results of the neural network for the anterior sagittal curvature map
- Results of the neural network for the posterior sagittal curvature map
- Results of the neural network for the anterior tangential curvature map
- Results of the neural network for the posterior tangential curvature map
- Results of the neural network for the thickness map
- Results of the neural network for the anterior elevation map
- Results of the neural network for the posterior elevation map
- Results of the neural network for the anterior refractive power map
- Results of the neural network for the posterior refractive power map
- Results of the neural network for the equivalent refractive power map
- Results of the overall accuracy of the AI system
- Results of the software accompanying the SIRIUS device
- Results of physician reading without AI system support
- Results of physician reading with AI system support
- Results of physician reading with SIRIUS device support
- Application of the McNemar test for comparison of the above models
6.1 Results of the Network for the Anterior Sagittal Curvature Map
The confusion matrices resulting from the training, validation, and test groups are displayed sequentially in Figures 48, 49, and 50. For each class, sensitivity, specificity, positive predictive value, negative predictive value, F1-score, and accuracy were calculated (Tables 16, 17, and 18).
6.1.1 Training Group
- Keratoconus: sensitivity 94.2%, specificity 97.4%, positive predictive value 61.6%, negative predictive value 99.7%, F1-score 93.9%; accuracy for detecting this class 96.5%.
- Normal corneas: sensitivity 98.4%, specificity 75.0%, positive predictive value 94.7%, negative predictive value 90.9%, F1-score 92.2%; accuracy 89.6%.
- Suspect corneas: sensitivity 1.5%, specificity 100.0%, positive predictive value 100.0%, negative predictive value 86.4%, F1-score 2.9%; accuracy 91.5%.
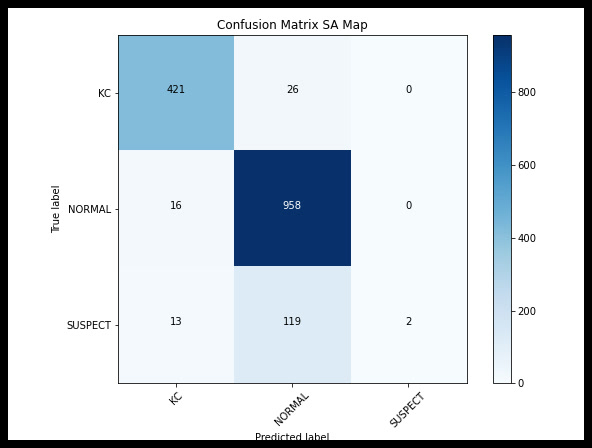
Table 16: Accuracy metrics of the training group (anterior sagittal curvature map).
6.1.2 Validation Group
- Keratoconus: sensitivity 98.2%, specificity 96.0%, positive predictive value 52.3%, negative predictive value 99.9%, F1-score 94.4%; accuracy 96.6%.
- Normal corneas: sensitivity 99.2%, specificity 81.9%, positive predictive value 96.2%, negative predictive value 95.6%, F1-score 94.5%; accuracy 92.8%.
- Suspect corneas: sensitivity 0.0%, specificity 100.0%, positive predictive value nan%, negative predictive value 86.3%, F1-score nan%; accuracy 91.5%.
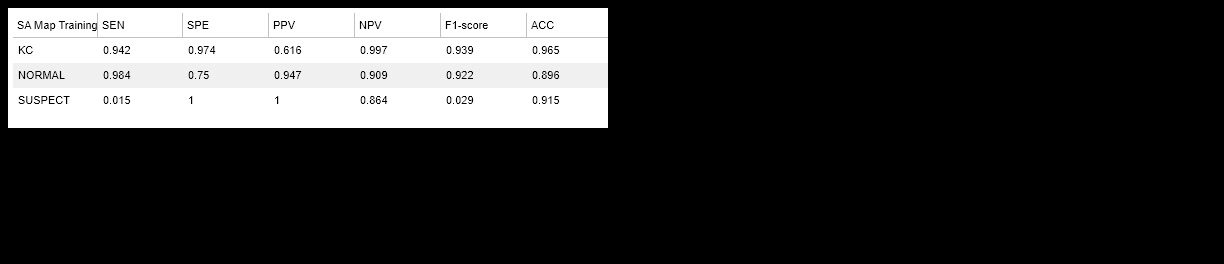
Table 17: Accuracy metrics of the validation group (anterior sagittal curvature map).
6.1.3 Test Group
- Keratoconus: sensitivity 100.0%, specificity 91.0%, positive predictive value 33.0%, negative predictive value 100.0%, F1-score 41.3%; accuracy 91.2%.
- Normal corneas: sensitivity 93.4%, specificity 46.4%, positive predictive value 88.8%, negative predictive value 60.9%, F1-score 92.7%; accuracy 87.2%.
- Suspect corneas: sensitivity 0.0%, specificity 100.0%, positive predictive value nan%, negative predictive value 86.3%, F1-score nan%; accuracy 89.8%.
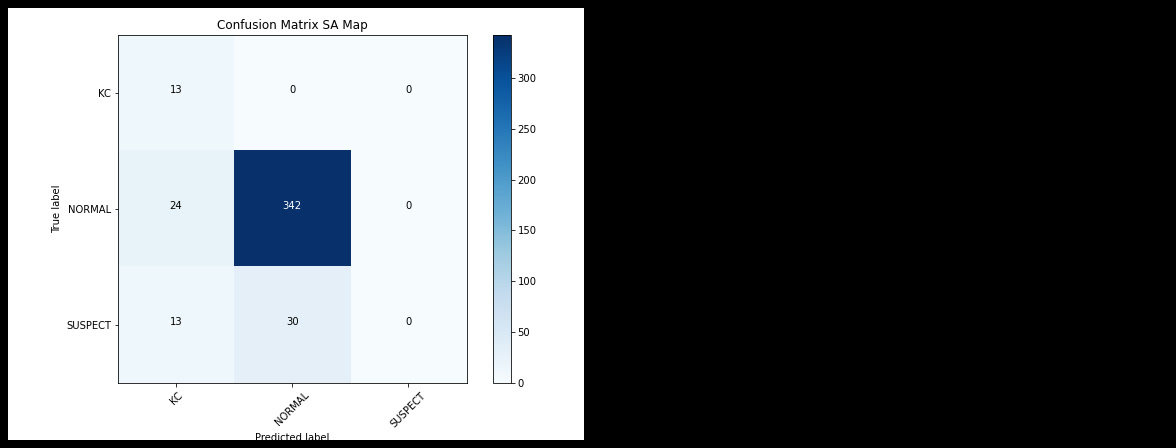
Table 18: Accuracy metrics of the test group (anterior sagittal curvature map).
6.2 Results of the Network for the Posterior Sagittal Curvature Map
The confusion matrices resulting from the training, validation, and test groups are displayed sequentially in Figures 51, 52, and 53. For each class, sensitivity, specificity, positive and negative predictive value, F1-score, and accuracy were calculated (Tables 19, 20, and 21).
6.2.1 Training Group
- Keratoconus: sensitivity 95.1%, specificity 98.3%, positive predictive value 71.2%, negative predictive value 99.8%, F1-score 95.4%; accuracy 97.4%.
- Normal corneas: sensitivity 99.5%, specificity 75.6%, positive predictive value 94.9%, negative predictive value 97.0%, F1-score 92.9%; accuracy 90.5%.
- Suspect corneas: sensitivity 0.0%, specificity 100.0%, positive predictive value nan%, negative predictive value 86.3%, F1-score nan%; accuracy 91.4%.
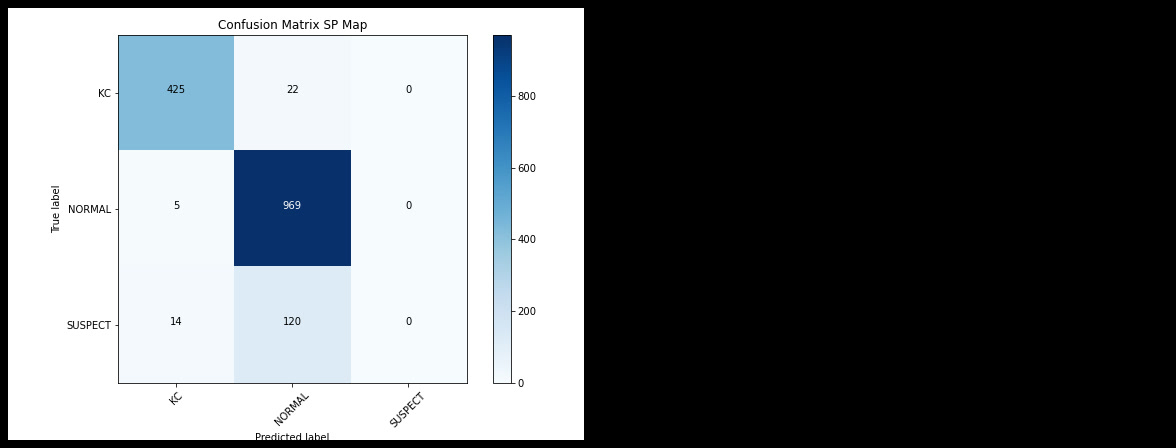
Table 19: Accuracy metrics of the training group (posterior sagittal curvature map).
6.2.2 Validation Group
- Keratoconus: sensitivity 97.3%, specificity 97.1%, positive predictive value 59.9%, negative predictive value 99.9%, F1-score 95.2%; accuracy 97.2%.
- Normal corneas: sensitivity 100.0%, specificity 80.6%, positive predictive value 95.9%, negative predictive value 100.0%, F1-score 94.6%; accuracy 92.8%.
- Suspect corneas: sensitivity 0.0%, specificity 100.0%, positive predictive value nan%, negative predictive value 86.3%, F1-score nan%; accuracy 91.5%.
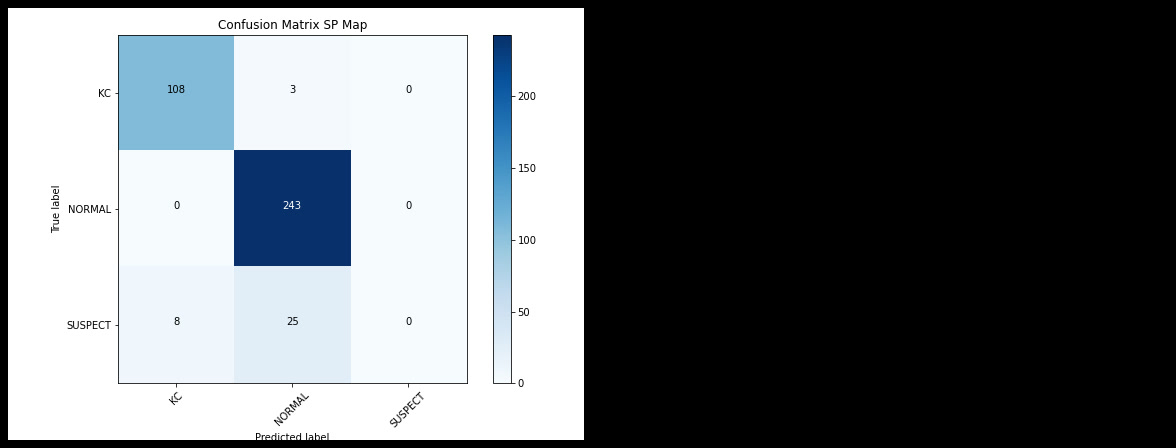
Table 20: Accuracy metrics of the validation group (posterior sagittal curvature map).
6.2.3 Test Group
- Keratoconus: sensitivity 92.3%, specificity 97.6%, positive predictive value 62.7%, negative predictive value 99.7%, F1-score 68.6%; accuracy 97.4%.
- Normal corneas: sensitivity 99.5%, specificity 35.7%, positive predictive value 87.6%, negative predictive value 93.5%, F1-score 95.0%; accuracy 91.0%.
- Suspect corneas: sensitivity 0.0%, specificity 100.0%, positive predictive value nan%, negative predictive value 86.3%, F1-score nan%; accuracy 89.8%.
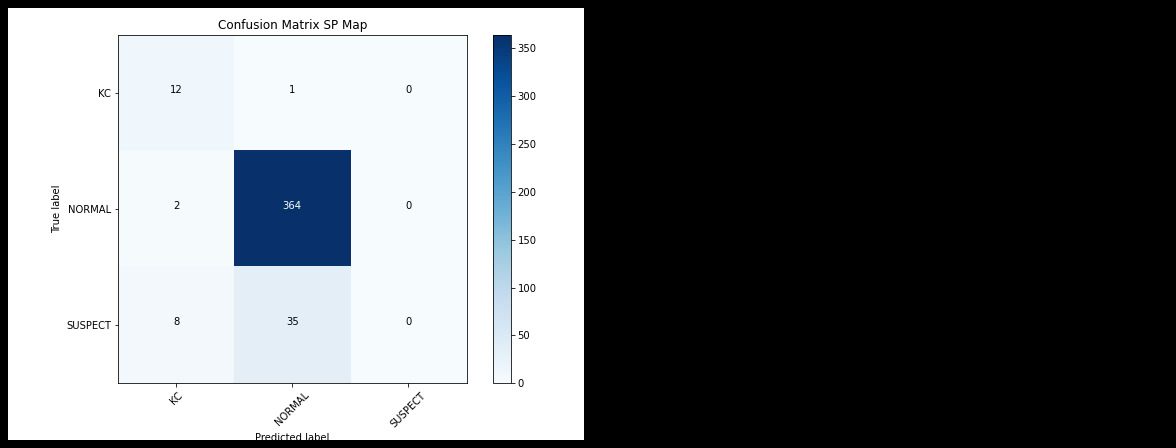
Table 21: Accuracy metrics of the test group (posterior sagittal curvature map).
6.3 Results of the Network for the Anterior Tangential Curvature Map
The confusion matrices resulting from the training, validation, and test groups are displayed sequentially in Figures 54, 55, and 56. For each class, sensitivity, specificity, positive and negative predictive value, F1-score, and accuracy were calculated (Tables 22, 23, and 24).
6.3.1 Training Group
- Keratoconus: sensitivity 85.2%, specificity 99.8%, positive predictive value 95.5%, negative predictive value 99.3%, F1-score 91.8%; accuracy 95.6%.
- Normal corneas: sensitivity 99.9%, specificity 66.1%, positive predictive value 93.1%, negative predictive value 99.3%, F1-score 90.8%; accuracy 87.3%.
- Suspect corneas: sensitivity 0.0%, specificity 99.9%, positive predictive value 0.0%, negative predictive value 86.2%, F1-score nan%; accuracy 91.3%.
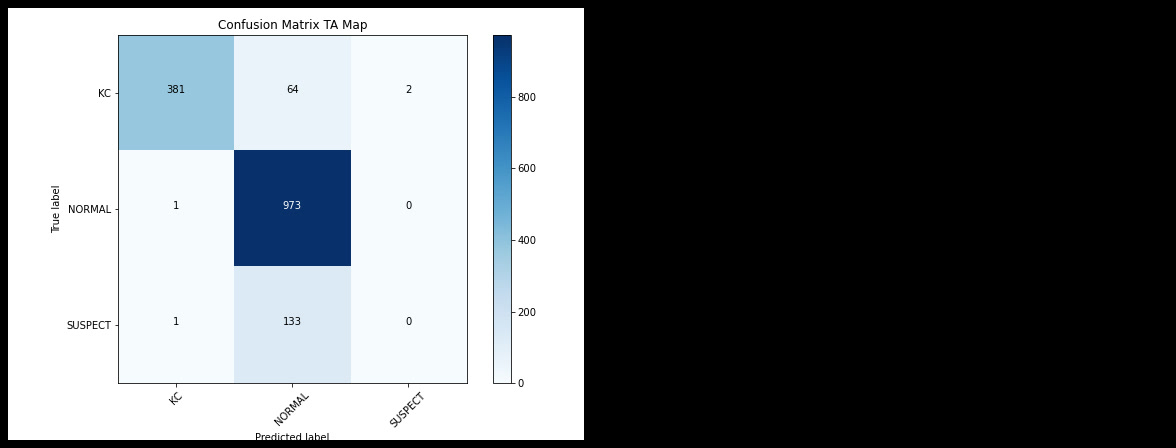
Table 22: Accuracy metrics of the training group (anterior tangential curvature map).
6.3.2 Validation Group
- Keratoconus: sensitivity 88.3%, specificity 97.5%, positive predictive value 60.8%, negative predictive value 99.5%, F1-score 90.7%; accuracy 94.8%.
- Normal corneas: sensitivity 99.2%, specificity 72.2%, positive predictive value 94.2%, negative predictive value 95.1%, F1-score 92.0%; accuracy 89.1%.
- Suspect corneas: sensitivity 0.0%, specificity 99.7%, positive predictive value 0.0%, negative predictive value 86.2%, F1-score nan%; accuracy 91.2%.
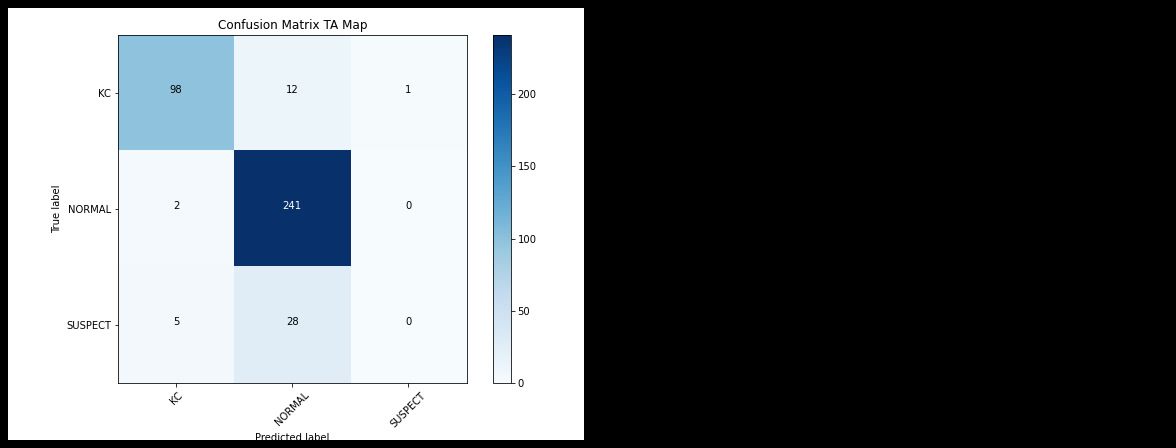
Table 23: Accuracy metrics of the validation group (anterior tangential curvature map).
6.3.3 Test Group
- Keratoconus: sensitivity 92.3%, specificity 99.8%, positive predictive value 94.4%, negative predictive value 99.7%, F1-score 92.3%; accuracy 99.5%.
- Normal corneas: sensitivity 100.0%, specificity 23.2%, positive predictive value 85.6%, negative predictive value 100.0%, F1-score 94.5%; accuracy 89.8%.
- Suspect corneas: sensitivity 0.0%, specificity 100.0%, positive predictive value nan%, negative predictive value 86.3%, F1-score nan%; accuracy 89.8%.
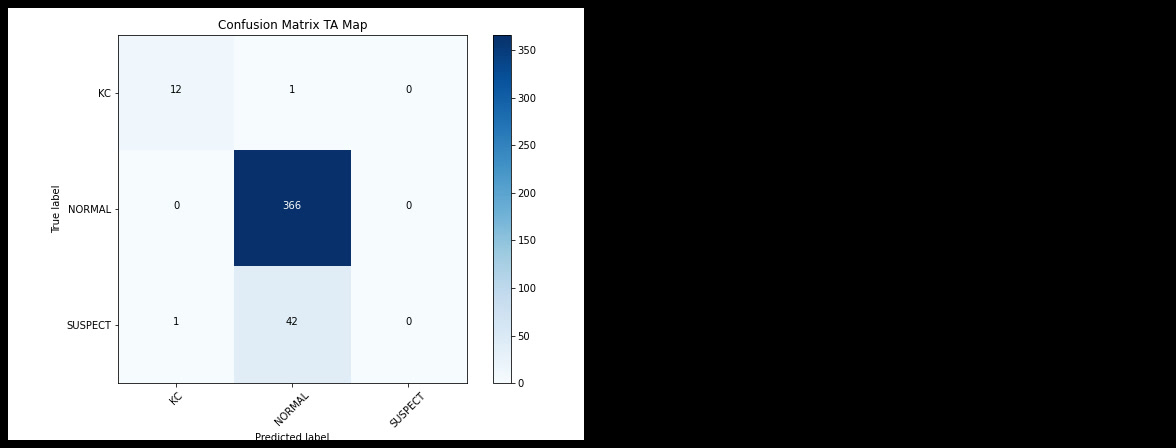
Table 24: Accuracy metrics of the test group (anterior tangential curvature map).
6.4 Results of the Network for the Posterior Tangential Curvature Map
The confusion matrices resulting from the training, validation, and test groups are displayed sequentially in Figures 57, 58, and 59. For each class, sensitivity, specificity, positive and negative predictive value, F1-score, and accuracy were calculated (Tables 25, 26, and 27).
6.4.1 Training Group
- Keratoconus: sensitivity 94.9%, specificity 99.2%, positive predictive value 83.9%, negative predictive value 99.8%, F1-score 96.4%; accuracy 97.9%.
- Normal corneas: sensitivity 99.6%, specificity 75.7%, positive predictive value 94.9%, negative predictive value 97.6%, F1-score 93.0%; accuracy 90.7%.
- Suspect corneas: sensitivity 2.2%, specificity 99.4%, positive predictive value 38.8%, negative predictive value 86.5%, F1-score 4.1%; accuracy 91.1%.
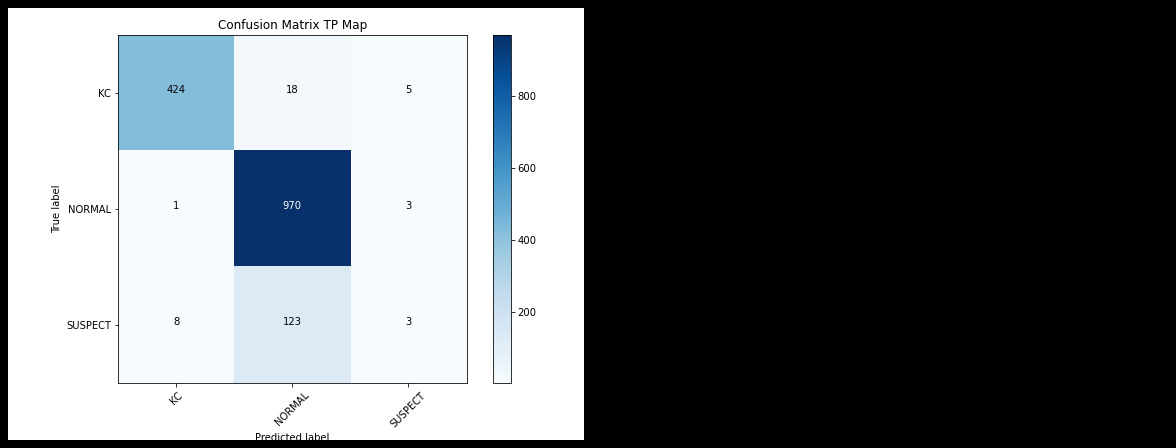
Table 25: Accuracy metrics of the training group (posterior tangential curvature map).
6.4.2 Validation Group
- Keratoconus: sensitivity 93.7%, specificity 97.1%, positive predictive value 59.0%, negative predictive value 99.7%, F1-score 93.3%; accuracy 96.1%.
- Normal corneas: sensitivity 99.6%, specificity 81.2%, positive predictive value 96.0%, negative predictive value 97.7%, F1-score 94.5%; accuracy 92.8%.
- Suspect corneas: sensitivity 3.0%, specificity 98.6%, positive predictive value 25.5%, negative predictive value 86.5%, F1-score 5.1%; accuracy 90.4%.
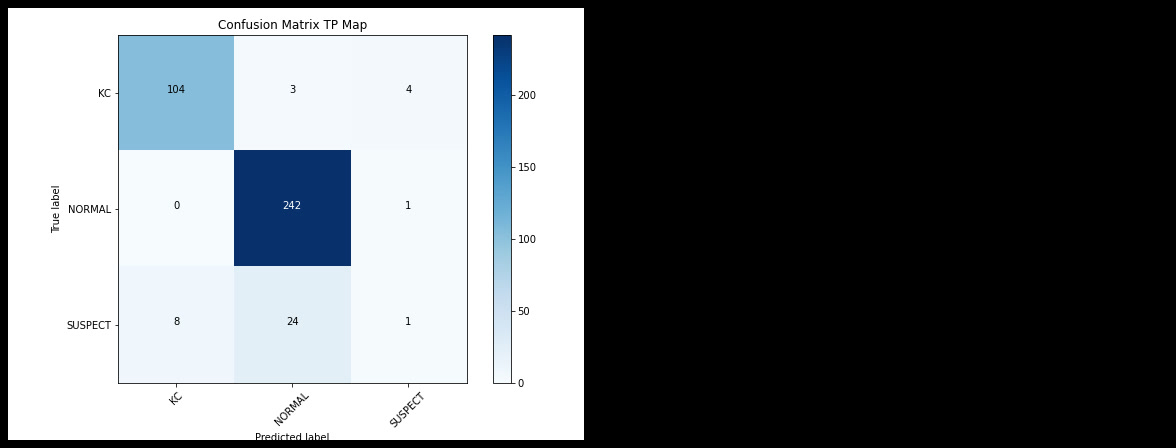
Table 26: Accuracy metrics of the validation group (posterior tangential curvature map).
6.4.3 Test Group
- Keratoconus: sensitivity 92.3%, specificity 99.5%, positive predictive value 89.4%, negative predictive value 99.7%, F1-score 88.9%; accuracy 99.3%.
- Normal corneas: sensitivity 100.0%, specificity 25.0%, positive predictive value 85.9%, negative predictive value 100.0%, F1-score 94.6%; accuracy 90.0%.
- Suspect corneas: sensitivity 0.0%, specificity 100.0%, positive predictive value nan%, negative predictive value 86.3%, F1-score nan%; accuracy 89.8%.
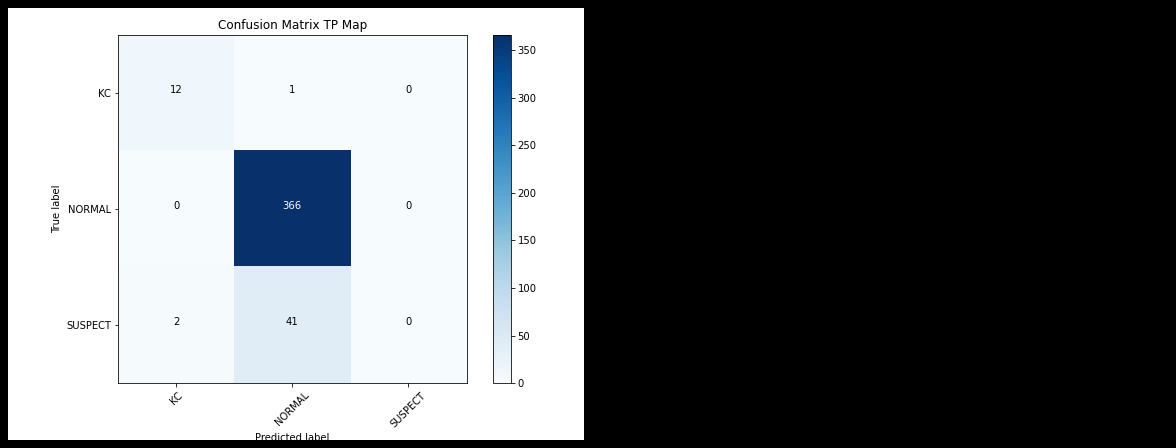
Table 27: Accuracy metrics of the test group (posterior tangential curvature map).
6.5 Results of the Network for the Thickness Map
The confusion matrices resulting from the training, validation, and test groups are displayed sequentially in Figures 60, 61, and 62. For each class, sensitivity, specificity, positive and negative predictive value, F1-score, and accuracy were calculated (Tables 28, 29, and 30).
6.5.1 Training Group
- Keratoconus: sensitivity 84.3%, specificity 93.9%, positive predictive value 37.9%, negative predictive value 99.3%, F1-score 84.5%; accuracy 91.1%.
- Normal corneas: sensitivity 94.5%, specificity 74.4%, positive predictive value 94.4%, negative predictive value 74.7%, F1-score 90.1%; accuracy 86.9%.
- Suspect corneas: sensitivity 3.0%, specificity 97.4%, positive predictive value 15.4%, negative predictive value 86.3%, F1-score 4.6%; accuracy 89.3%.
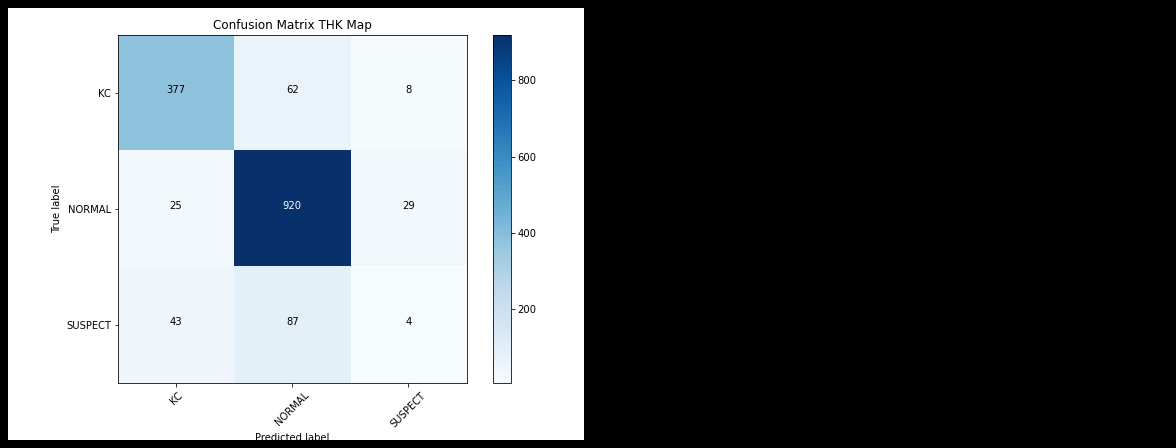
Table 28: Accuracy metrics of the training group (thickness map).
6.5.2 Validation Group
- Keratoconus: sensitivity 79.3%, specificity 93.1%, positive predictive value 33.9%, negative predictive value 99.0%, F1-score 80.7%; accuracy 89.1%.
- Normal corneas: sensitivity 96.7%, specificity 74.3%, positive predictive value 94.5%, negative predictive value 83.2%, F1-score 91.3%; accuracy 88.4%.
- Suspect corneas: sensitivity 3.0%, specificity 98.0%, positive predictive value 19.6%, negative predictive value 86.4%, F1-score 4.9%; accuracy 89.9%.
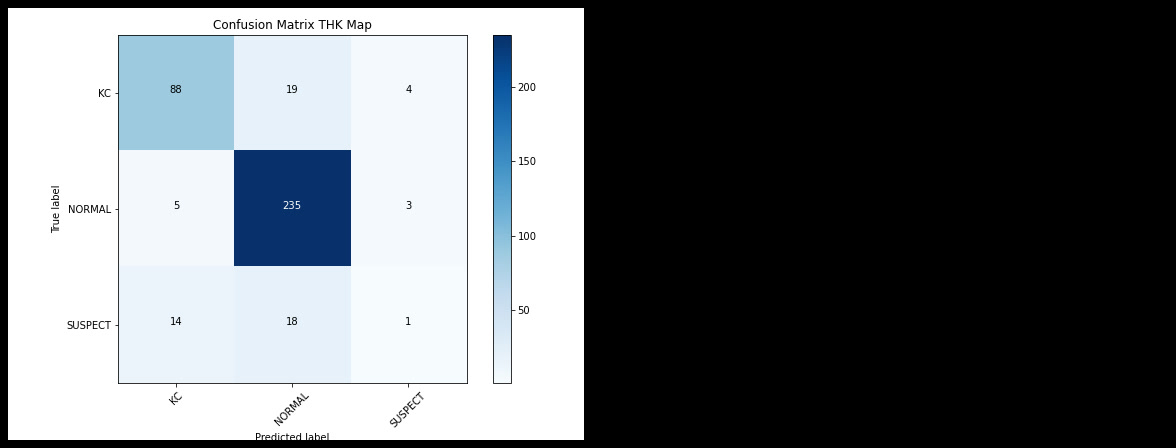
Table 29: Accuracy metrics of the validation group (thickness map).
6.5.3 Test Group
- Keratoconus: sensitivity 76.9%, specificity 94.1%, positive predictive value 36.8%, negative predictive value 98.9%, F1-score 42.6%; accuracy 93.6%.
- Normal corneas: sensitivity 96.4%, specificity 41.1%, positive predictive value 88.2%, negative predictive value 71.8%, F1-score 93.9%; accuracy 89.1%.
- Suspect corneas: sensitivity 0.0%, specificity 99.5%, positive predictive value 0.0%, negative predictive value 86.2%, F1-score nan%; accuracy 89.3%.
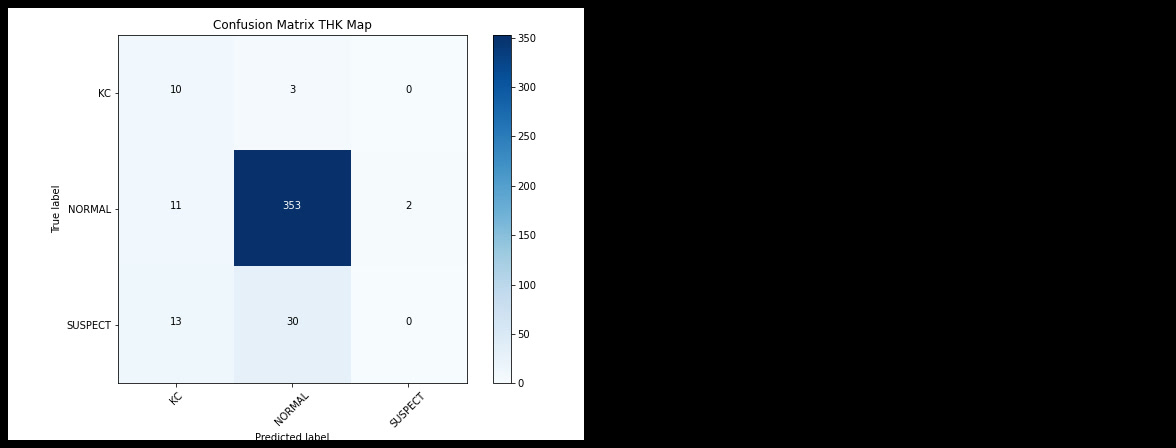
Table 30: Accuracy metrics of the test group (thickness map).
6.6 Results of the Network for the Anterior Elevation Map
The confusion matrices resulting from the training, validation, and test groups are displayed sequentially in Figures 63, 64, and 65. For each class, sensitivity, specificity, positive and negative predictive value, F1-score, and accuracy were calculated (Tables 31, 32, and 33).
6.6.1 Training Group
- Keratoconus: sensitivity 93.5%, specificity 97.1%, positive predictive value 59.0%, negative predictive value 99.7%, F1-score 93.2%; accuracy 96.1%.
- Normal corneas: sensitivity 98.3%, specificity 78.1%, positive predictive value 95.3%, negative predictive value 90.8%, F1-score 93.0%; accuracy 90.7%.
- Suspect corneas: sensitivity 6.7%, specificity 99.2%, positive predictive value 55.9%, negative predictive value 87.0%, F1-score 11.6%; accuracy 91.2%.
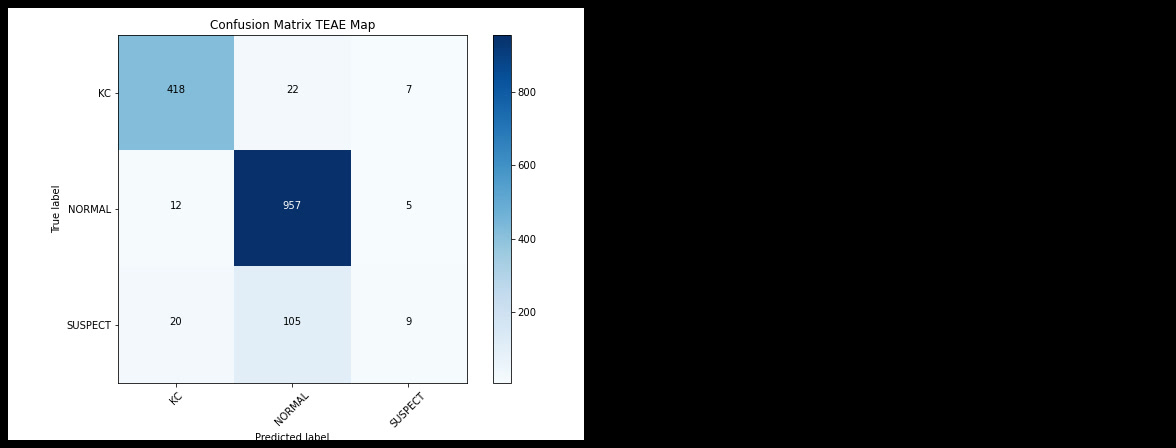
Table 31: Accuracy metrics of the training group (anterior elevation map).
6.6.2 Validation Group
- Keratoconus: sensitivity 98.2%, specificity 96.7%, positive predictive value 57.3%, negative predictive value 99.9%, F1-score 95.2%; accuracy 97.2%.
- Normal corneas: sensitivity 99.2%, specificity 83.3%, positive predictive value 96.4%, negative predictive value 95.7%, F1-score 94.9%; accuracy 93.3%.
- Suspect corneas: sensitivity 9.1%, specificity 99.7%, positive predictive value 83.7%, negative predictive value 87.3%, F1-score 16.2%; accuracy 92.0%.
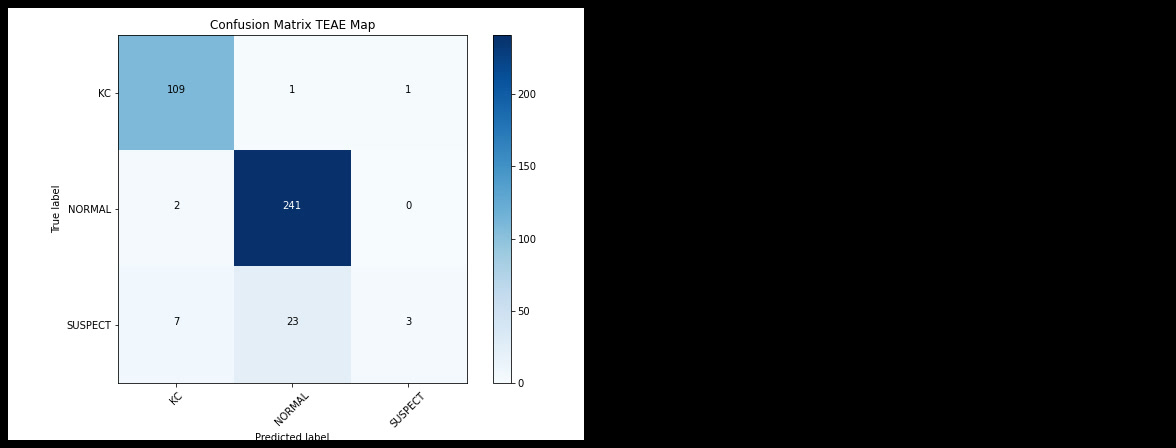
Table 32: Accuracy metrics of the validation group (anterior elevation map).
6.6.3 Test Group
- Keratoconus: sensitivity 100.0%, specificity 96.1%, positive predictive value 53.2%, negative predictive value 100.0%, F1-score 61.9%; accuracy 96.2%.
- Normal corneas: sensitivity 98.4%, specificity 50.0%, positive predictive value 90.0%, negative predictive value 87.0%, F1-score 95.5%; accuracy 91.9%.
- Suspect corneas: sensitivity 9.3%, specificity 99.7%, positive predictive value 84.9%, negative predictive value 87.3%, F1-score 16.7%; accuracy 90.5%.
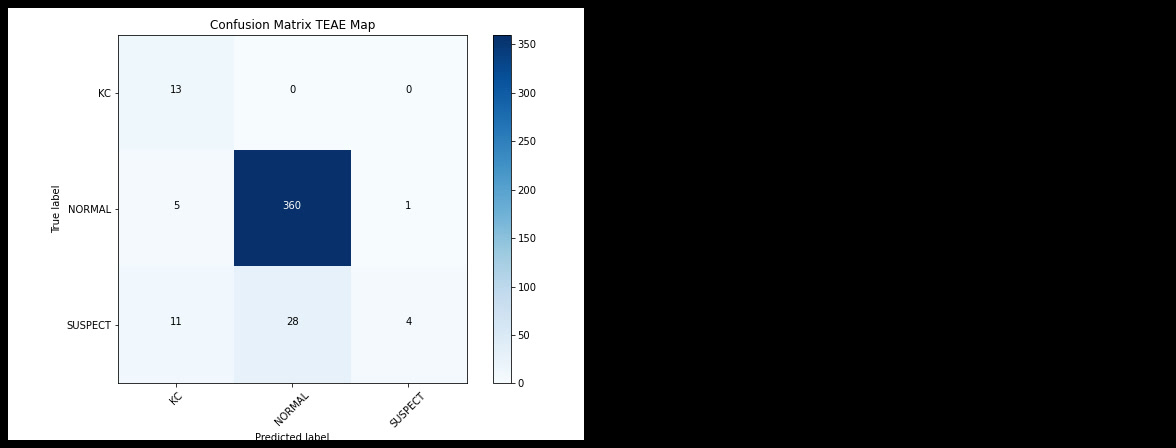
Table 33: Accuracy metrics of the test/validation group (anterior elevation map; label as in source).
6.7 Results of the Network for the Posterior Elevation Map
The confusion matrices resulting from the training, validation, and test groups are displayed sequentially in Figures 66, 67, and 68. For each class, sensitivity, specificity, positive and negative predictive value, F1-score, and accuracy were calculated (Tables 34, 35, and 36).
6.7.1 Training Group
- Keratoconus: sensitivity 96.9%, specificity 94.9%, positive predictive value 45.6%, negative predictive value 99.9%, F1-score 92.4%; accuracy 95.4%.
- Normal corneas: sensitivity 98.3%, specificity 86.2%, positive predictive value 97.0%, negative predictive value 91.6%, F1-score 95.2%; accuracy 93.8%.
- Suspect corneas: sensitivity 9.0%, specificity 98.9%, positive predictive value 55.9%, negative predictive value 87.2%, F1-score 14.8%; accuracy 91.1%.
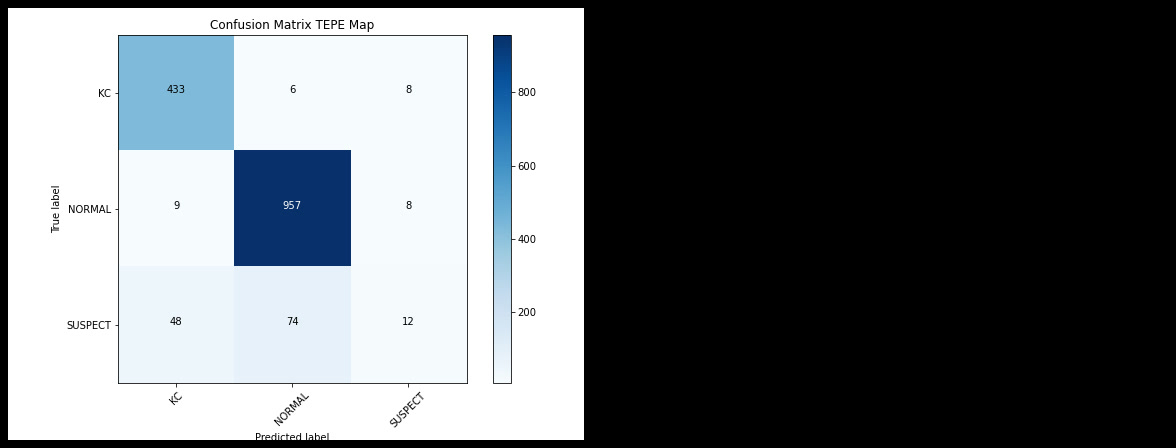
Table 34: Accuracy metrics of the training group (posterior elevation map).
6.7.2 Validation Group
- Keratoconus: sensitivity 97.3%, specificity 94.9%, positive predictive value 46.0%, negative predictive value 99.9%, F1-score 92.7%; accuracy 95.6%.
- Normal corneas: sensitivity 97.9%, specificity 88.2%, positive predictive value 97.4%, negative predictive value 90.4%, F1-score 95.6%; accuracy 94.3%.
- Suspect corneas: sensitivity 12.1%, specificity 98.3%, positive predictive value 53.3%, negative predictive value 87.5%, F1-score 18.6%; accuracy 91.0%.
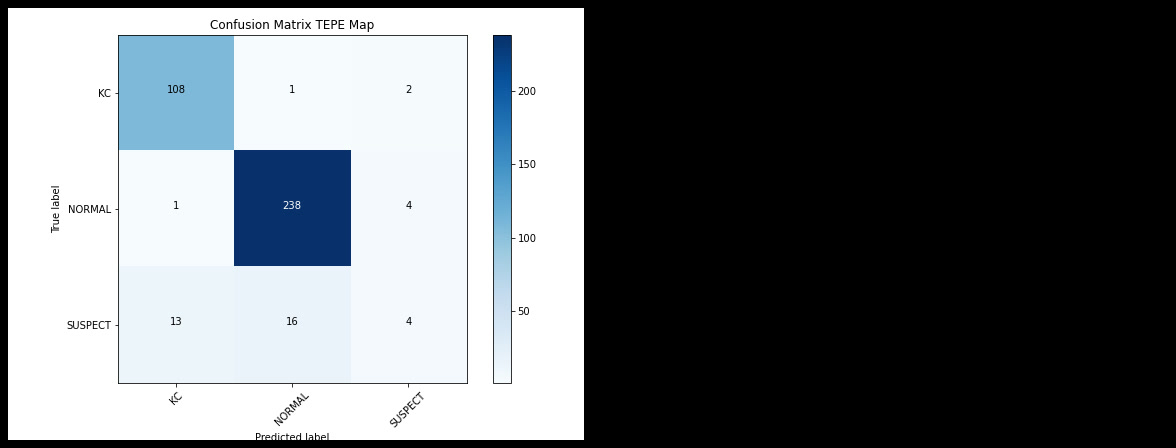
Table 35: Accuracy metrics of the validation group (posterior elevation map).
6.7.3 Test Group
- Keratoconus: sensitivity 100.0%, specificity 96.1%, positive predictive value 53.2%, negative predictive value 100.0%, F1-score 61.9%; accuracy 96.2%.
- Normal corneas: sensitivity 96.7%, specificity 53.6%, positive predictive value 90.5%, negative predictive value 78.2%, F1-score 94.9%; accuracy 91.0%.
- Suspect corneas: sensitivity 7.0%, specificity 97.4%, positive predictive value 29.6%, negative predictive value 86.8%, F1-score 10.7%; accuracy 88.2%.
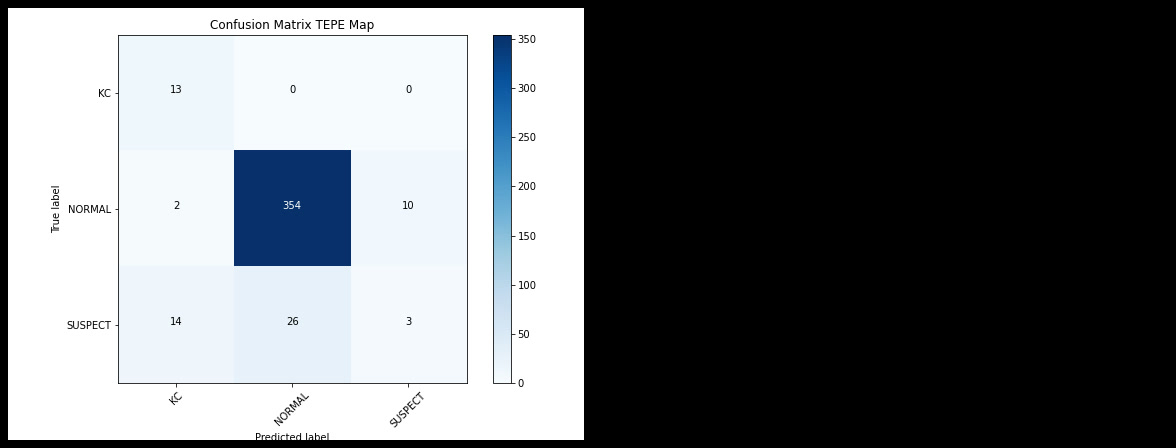
Table 36: Accuracy metrics of the test group (posterior elevation map).
6.8 Results of the Network for the Anterior Refractive Power Map
The confusion matrices resulting from the training, validation, and test groups are displayed sequentially in Figures 69, 70, and 71. For each class, sensitivity, specificity, positive and negative predictive value, F1-score, and accuracy were calculated (Tables 37, 38, and 39).
6.8.1 Training Group
- Keratoconus: sensitivity 93.7%, specificity 98.5%, positive predictive value 73.1%, negative predictive value 99.7%, F1-score 94.9%; accuracy 97.1%.
- Normal corneas: sensitivity 98.9%, specificity 80.7%, positive predictive value 95.9%, negative predictive value 94.0%, F1-score 94.0%; accuracy 92.1%.
- Suspect corneas: sensitivity 21.6%, specificity 98.9%, positive predictive value 76.6%, negative predictive value 88.8%, F1-score 32.6%; accuracy 92.3%.
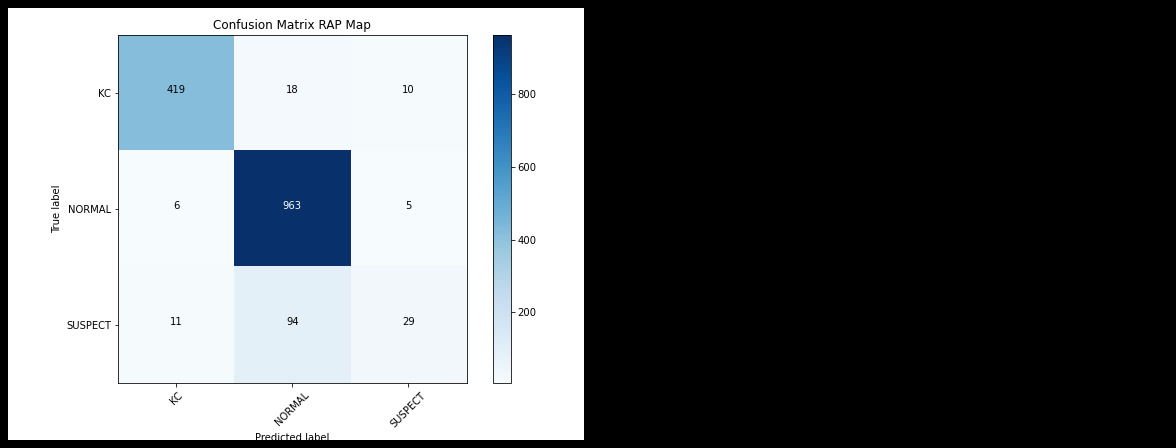
Table 37: Accuracy metrics of the training group (anterior refractive power map).
6.8.2 Validation Group
- Keratoconus: sensitivity 94.6%, specificity 94.9%, positive predictive value 45.3%, negative predictive value 99.7%, F1-score 91.3%; accuracy 94.8%.
- Normal corneas: sensitivity 91.8%, specificity 83.3%, positive predictive value 96.2%, negative predictive value 69.0%, F1-score 91.0%; accuracy 88.6%.
- Suspect corneas: sensitivity 12.1%, specificity 95.2%, positive predictive value 28.7%, negative predictive value 87.2%, F1-score 14.8%; accuracy 88.1%.
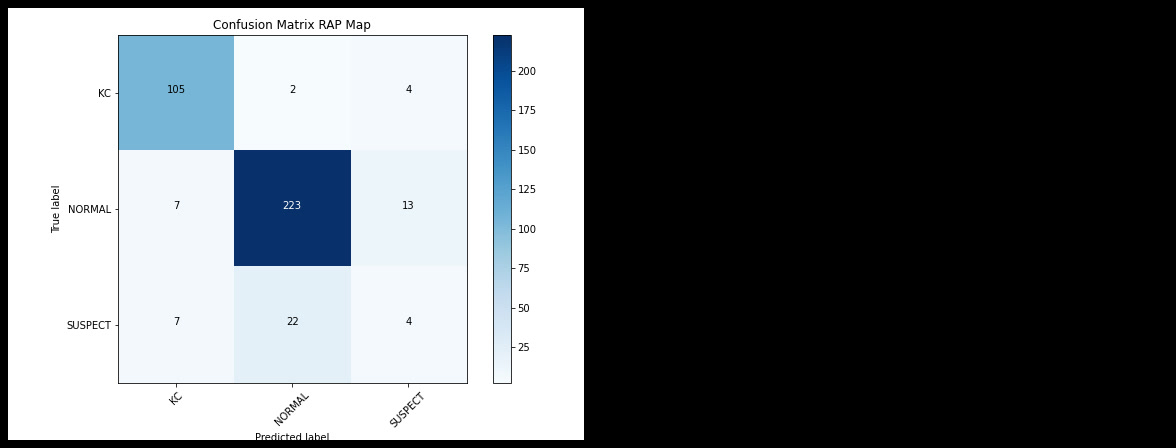
Table 38: Accuracy metrics of the validation group (anterior refractive power map).
6.8.3 Test Group (continued on S. 137)
- Keratoconus: sensitivity 84.6%, specificity 99.3%, positive predictive value 83.7%, negative predictive value 99.3%, F1-score 81.5%; accuracy 98.8%.
Note on footnote 1 of the source: When nan appears in the results or discussion section in text or tables, this means the value is undefined due to a denominator of zero. In most cases, the neural network was unable to correctly or incorrectly detect any suspect corneal case; as a result, the positive predictive value or F1-score could not be calculated. Alternatively, sensitivity and positive predictive value were both zero, so the F1-score was undefined.
S. 138–157 – Results, Model Comparisons and McNemar Tests
Continuation 6.8.3 Test group: anterior refractive power map
- Normal corneas: Sensitivity 100.0%, specificity 28.6%, positive predictive value 86.4%, negative predictive value 100.0%, F1-score 94.8%; accuracy 90.5%.
- Suspect corneas: Sensitivity 2.3%, specificity 99.7%, positive predictive value 58.4%, negative predictive value 86.5%, F1-score 4.4%; accuracy 89.8%.
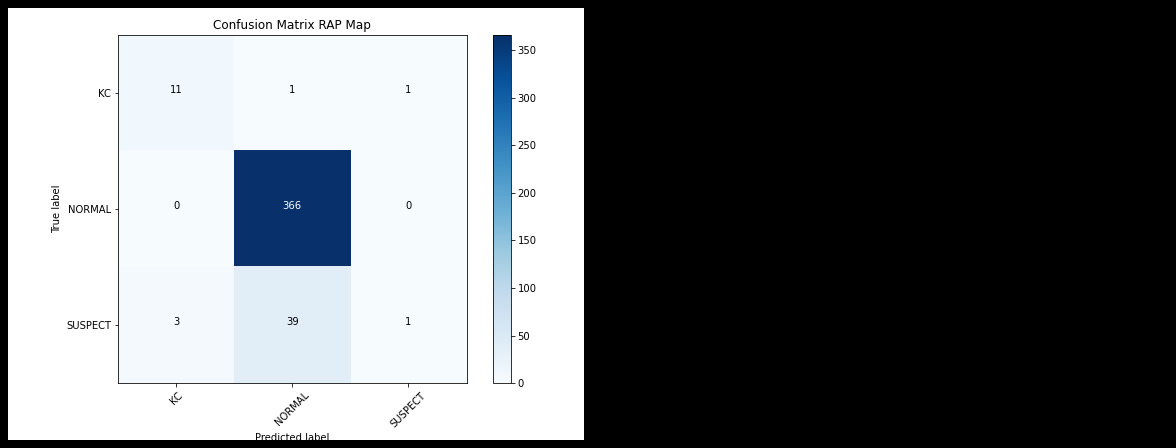
Table 39: Accuracy metrics of the test group (anterior refractive power map).
6.9 Results of the network for the posterior refractive power map
The confusion matrices resulting from the training, validation, and test groups are shown sequentially in Figures 72, 73, and 74. For each class, sensitivity, specificity, positive and negative predictive value, F1-score, and accuracy were calculated (Tables 40, 41, and 42).
6.9.1 Training group
- Keratoconus: Sensitivity 91.7%, specificity 99.2%, positive predictive value 83.4%, negative predictive value 99.6%, F1-score 94.7%; accuracy 97.0%.
- Normal corneas: Sensitivity 99.9%, specificity 71.9%, positive predictive value 94.2%, negative predictive value 99.4%, F1-score 92.2%; accuracy 89.5%.
- Suspect corneas: Sensitivity 0.0%, specificity 100.0%, positive predictive value nan%, negative predictive value 86.3%, F1-score nan%; accuracy 91.4%.
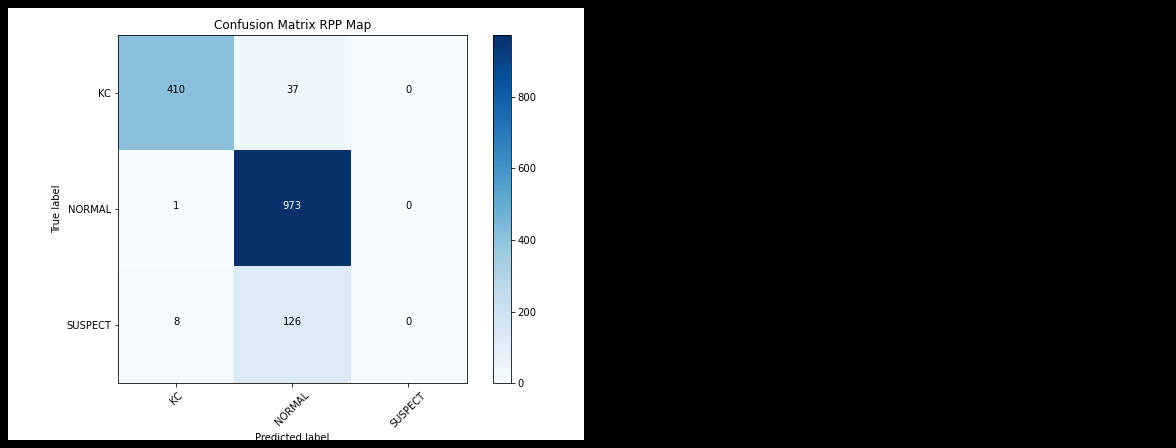
Table 40: Accuracy metrics of the training group (posterior refractive power map).
6.9.2 Validation group
- Keratoconus: Sensitivity 97.3%, specificity 97.8%, positive predictive value 66.6%, negative predictive value 99.9%, F1-score 96.0%; accuracy 97.7%.
- Normal corneas: Sensitivity 100.0%, specificity 79.2%, positive predictive value 95.6%, negative predictive value 100.0%, F1-score 94.2%; accuracy 92.2%.
- Suspect corneas: Sensitivity 0.0%, specificity 100.0%, positive predictive value nan%, negative predictive value 86.3%, F1-score nan%; accuracy 91.5%.
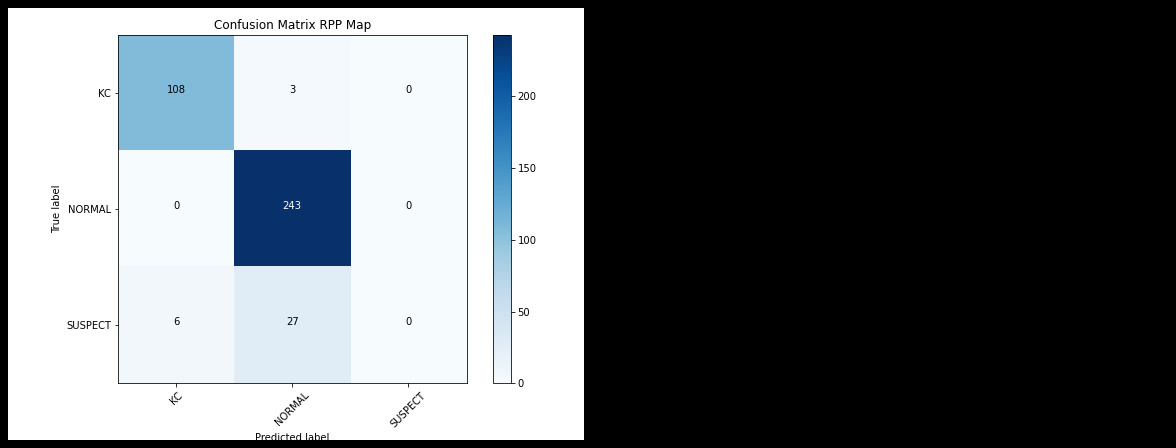
Table 41: Accuracy metrics of the validation group (posterior refractive power map).
6.9.3 Test group
- Keratoconus: Sensitivity 92.3%, specificity 99.3%, positive predictive value 84.8%, negative predictive value 99.7%, F1-score 85.7%; accuracy 99.1%.
- Normal corneas: Sensitivity 100.0%, specificity 26.8%, positive predictive value 86.1%, negative predictive value 100.0%, F1-score 94.7%; accuracy 90.3%.
- Suspect corneas: Sensitivity 0.0%, specificity 100.0%, positive predictive value nan%, negative predictive value 86.3%, F1-score nan%; accuracy 89.8%.
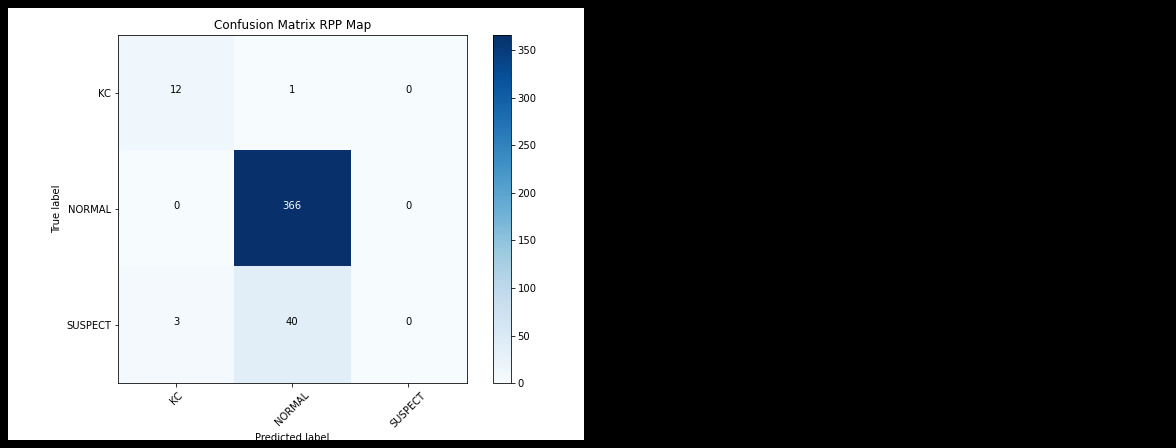
Table 42: Accuracy metrics of the test group (posterior refractive power map).
6.10 Results of the network for the equivalent refractive power map
The confusion matrices resulting from the training, validation, and test groups are shown sequentially in Figures 75, 76, and 77. For each class, sensitivity, specificity, positive and negative predictive value, F1-score, and accuracy were calculated (Tables 43, 44, and 45).
6.10.1 Training group
- Keratoconus: Sensitivity 91.9%, specificity 98.5%, positive predictive value 72.7%, negative predictive value 99.6%, F1-score 93.9%; accuracy 96.6%.
- Normal corneas: Sensitivity 98.5%, specificity 73.8%, positive predictive value 94.5%, negative predictive value 91.3%, F1-score 92.0%; accuracy 89.3%.
- Suspect corneas: Sensitivity 3.7%, specificity 99.2%, positive predictive value 43.4%, negative predictive value 86.6%, F1-score 6.7%; accuracy 91.0%.
Table 43: Accuracy metrics of the training group (equivalent refractive power map).
6.10.2 Validation group
- Keratoconus: Sensitivity 96.4%, specificity 96.4%, positive predictive value 54.2%, negative predictive value 99.8%, F1-score 93.9%; accuracy 96.4%.
- Normal corneas: Sensitivity 99.2%, specificity 81.2%, positive predictive value 96.0%, negative predictive value 95.6%, F1-score 94.3%; accuracy 92.5%.
- Suspect corneas: Sensitivity 3.0%, specificity 99.7%, positive predictive value 63.1%, negative predictive value 86.6%, F1-score 5.7%; accuracy 91.5%.
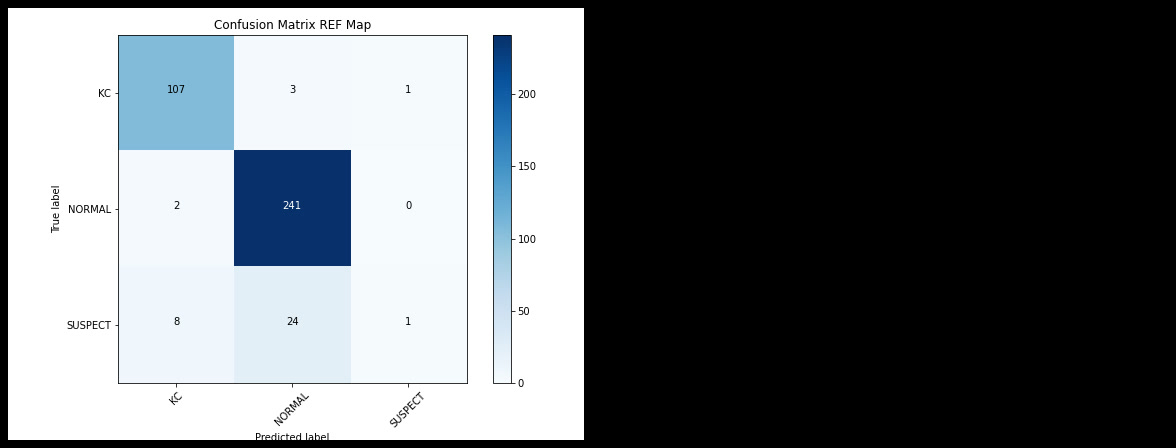
Table 44: Accuracy metrics of the validation group (equivalent refractive power map).
6.10.3 Test group
- Keratoconus: Sensitivity 92.3%, specificity 98.5%, positive predictive value 73.7%, negative predictive value 99.7%, F1-score 77.4%; accuracy 98.3%.
- Normal corneas: Sensitivity 99.2%, specificity 33.9%, positive predictive value 87.2%, negative predictive value 90.1%, F1-score 94.8%; accuracy 90.5%.
- Suspect corneas: Sensitivity 2.3%, specificity 99.2%, positive predictive value 31.9%, negative predictive value 86.4%, F1-score 4.3%; accuracy 89.3%.
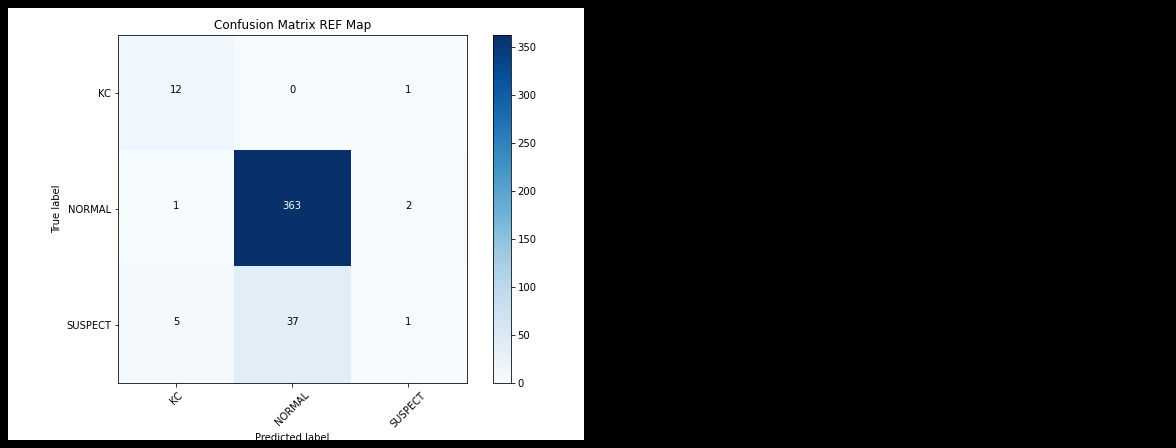
Table 45: Accuracy metrics of the test group (equivalent refractive power map).
6.11 Results of the overall accuracy of the AI system
The confusion matrices resulting from the training, validation, and test groups are shown sequentially in Figures 78, 79, and 80. For each class, sensitivity, specificity, positive and negative predictive value, F1-score, and accuracy were calculated (Tables 46, 47, and 48).
6.11.1 Training group
- Keratoconus: Sensitivity 94.6%, specificity 99.8%, positive predictive value 95.9%, negative predictive value 99.8%, F1-score 97.0%; accuracy 98.3%.
- Normal corneas: Sensitivity 98.8%, specificity 91.7%, positive predictive value 98.2%, negative predictive value 94.2%, F1-score 97.0%; accuracy 96.1%.
- Suspect corneas: Sensitivity 62.7%, specificity 97.5%, positive predictive value 79.8%, negative predictive value 94.3%, F1-score 66.1%; accuracy 94.5%.
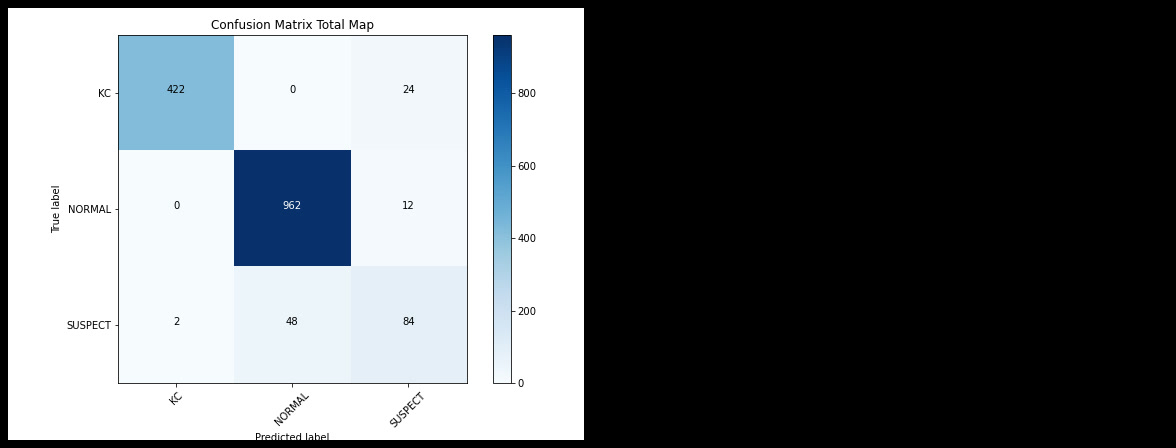
Table 46: Accuracy metrics of the training group (AI system).
6.11.2 Validation group
- Keratoconus: Sensitivity 93.8%, specificity 99.3%, positive predictive value 85.2%, negative predictive value 99.7%, F1-score 95.9%; accuracy 97.7%.
- Normal corneas: Sensitivity 98.8%, specificity 91.8%, positive predictive value 98.2%, negative predictive value 94.2%, F1-score 97.0%; accuracy 96.1%.
- Suspect corneas: Sensitivity 60.6%, specificity 97.5%, positive predictive value 79.2%, negative predictive value 94.0%, F1-score 64.5%; accuracy 94.3%.
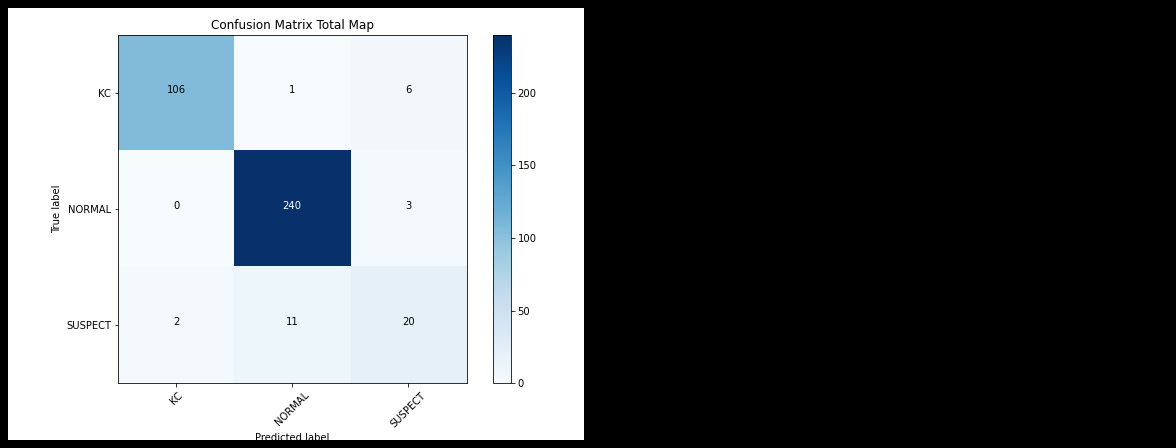
Table 47: Accuracy metrics of the validation group (AI system).
6.11.3 Test group
- Keratoconus: Sensitivity 92.3%, specificity 99.5%, positive predictive value 89.4%, negative predictive value 99.7%, F1-score 88.9%; accuracy 99.3%.
- Normal corneas: Sensitivity 98.4%, specificity 57.1%, positive predictive value 91.3%, negative predictive value 88.4%, F1-score 96.0%; accuracy 92.9%.
- Suspect corneas: Sensitivity 39.5%, specificity 98.2%, positive predictive value 77.3%, negative predictive value 91.1%, F1-score 50.7%; accuracy 92.2%.
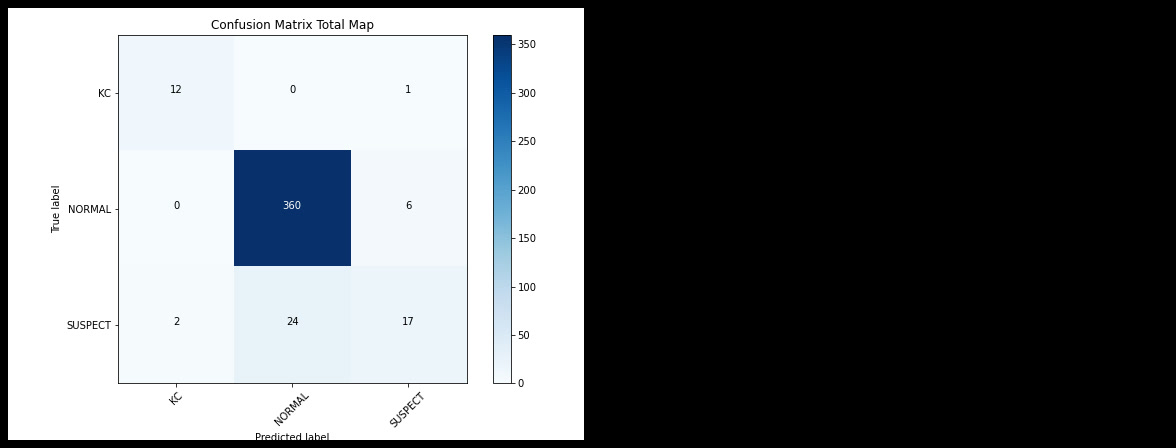
Table 48: Accuracy metrics of the test group (AI system).
6.12 Results of the SIRIUS device software
The confusion matrix of the test group is shown in Figure 81. For each class, sensitivity, specificity, positive and negative predictive value, F1-score, and accuracy were calculated (Table 49).
- Keratoconus: Sensitivity 84.6%, specificity 99.5%, positive predictive value 88.5%, negative predictive value 99.3%, F1-score 84.6%; accuracy 99.1%.
- Normal corneas: Sensitivity 98.1%, specificity 58.9%, positive predictive value 91.6%, negative predictive value 87.1%, F1-score 96.0%; accuracy 92.9%.
- Suspect corneas: Sensitivity 41.9%, specificity 97.6%, positive predictive value 73.7%, negative predictive value 91.3%, F1-score 51.4%; accuracy 91.9%.

Table 49: Accuracy metrics of the test group (SIRIUS).
6.13 Results of physician assessment without AI support
The confusion matrix of the test group is shown in Figure 82. For each class, sensitivity, specificity, positive and negative predictive value, F1-score, and accuracy were calculated (Table 50).
- Keratoconus: Sensitivity 84.6%, specificity 99.8%, positive predictive value 93.9%, negative predictive value 99.3%, F1-score 88.0%; accuracy 99.3%.
- Normal corneas: Sensitivity 98.1%, specificity 60.7%, positive predictive value 91.9%, negative predictive value 87.5%, F1-score 96.1%; accuracy 93.1%.
- Suspect corneas: Sensitivity 46.5%, specificity 97.6%, positive predictive value 75.7%, negative predictive value 92.0%, F1-score 55.6%; accuracy 92.4%.
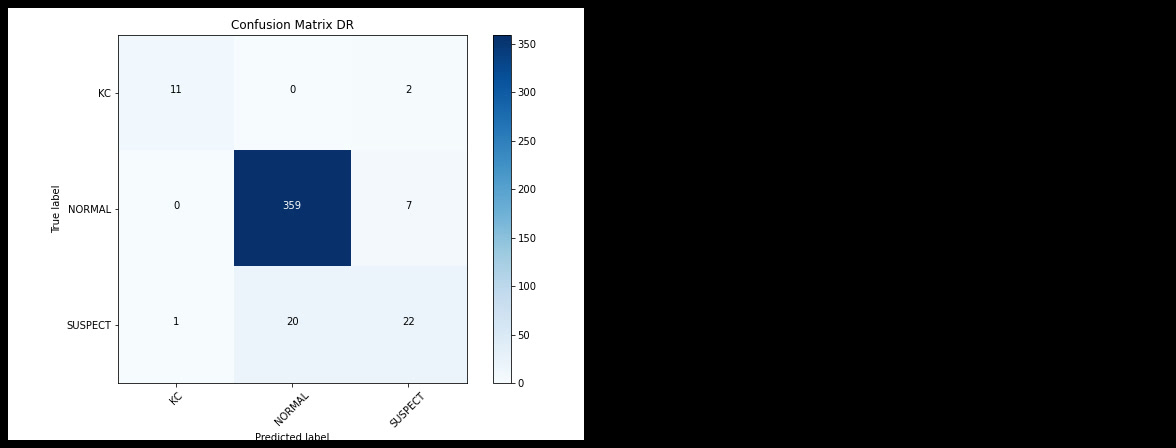
Table 50: Accuracy metrics of the test group (physician without AI support).
6.14 Results of physician assessment with AI support
The confusion matrix of the test group is shown in Figure 83. For each class, sensitivity, specificity, positive and negative predictive value, F1-score, and accuracy were calculated (Table 51).
- Keratoconus: Sensitivity 92.3%, specificity 99.8%, positive predictive value 94.4%, negative predictive value 99.7%, F1-score 92.3%; accuracy 99.5%.
- Normal corneas: Sensitivity 99.7%, specificity 76.8%, positive predictive value 95.1%, negative predictive value 98.4%, F1-score 98.1%; accuracy 96.7%.
- Suspect corneas: Sensitivity 67.4%, specificity 99.5%, positive predictive value 95.3%, negative predictive value 95.0%, F1-score 78.4%; accuracy 96.2%.
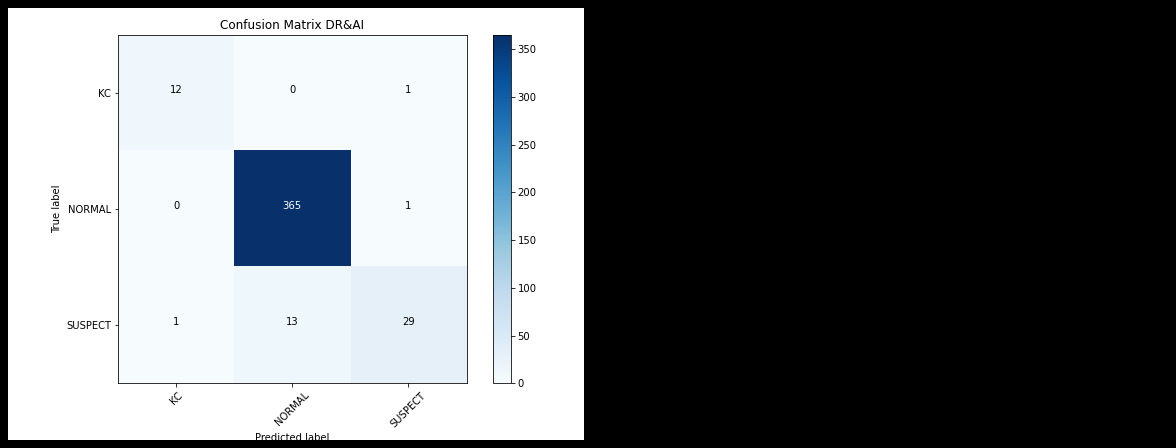
Table 51: Accuracy metrics of the test group (physician with AI system support).
6.15 Results of physician assessment with SIRIUS support
The confusion matrix of the test group is shown in Figure 84. For each class, sensitivity, specificity, positive and negative predictive value, F1-score, and accuracy were calculated (Table 52).
- Keratoconus: Sensitivity 92.3%, specificity 99.8%, positive predictive value 94.4%, negative predictive value 99.7%, F1-score 92.3%; accuracy 99.5%.
- Normal corneas: Sensitivity 98.9%, specificity 69.6%, positive predictive value 93.7%, negative predictive value 93.3%, F1-score 97.2%; accuracy 95.0%.
- Suspect corneas: Sensitivity 58.1%, specificity 98.7%, positive predictive value 87.5%, negative predictive value 93.7%, F1-score 68.5%; accuracy 94.5%.
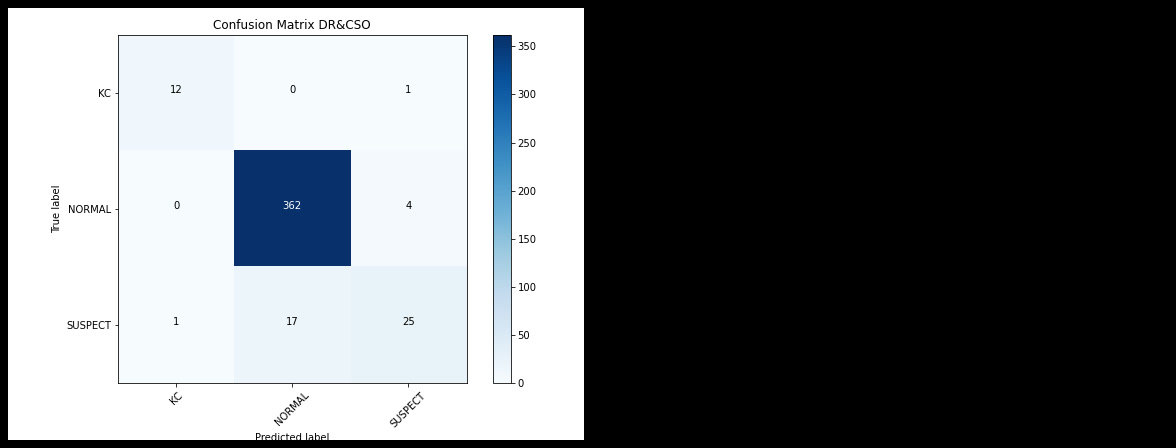
Table 52: Accuracy metrics of the test group (physician with SIRIUS device support).
6.16 Application of the McNemar test for comparing the above models
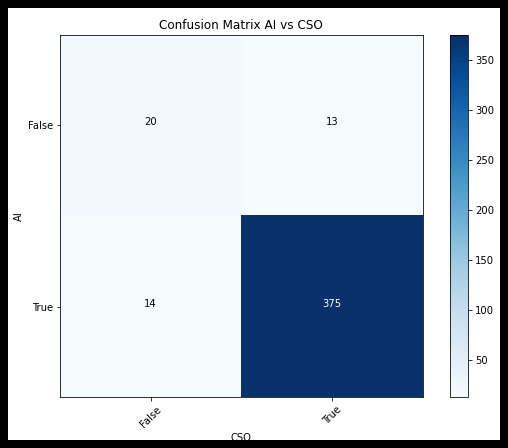
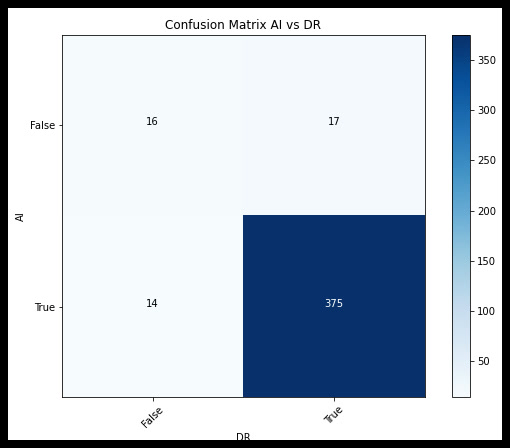
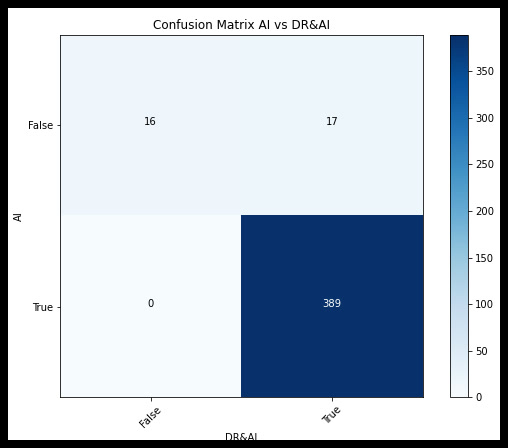
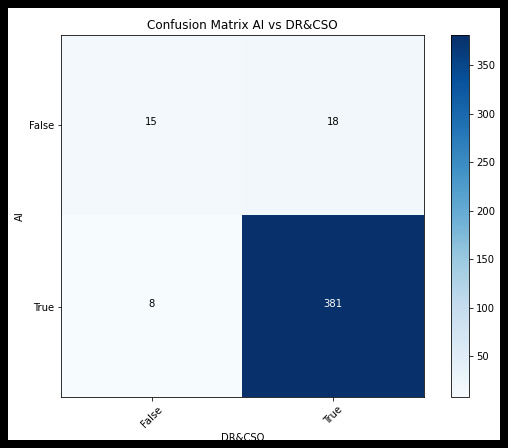
To determine whether a true difference existed between the above models (AI system, SIRIUS device, physician without support, physician with AI support, and physician with SIRIUS support), their results were compared using the McNemar test. Two models were compared at a time (Table 53, Figures 85–94).
Table 53: Summary of McNemar tests.
6.16.1 AI system vs. SIRIUS device
When the McNemar test was applied to the binary confusion matrix (correct vs. incorrect results of the two models), P = 100.0% > 5%. Thus, no statistically significant difference existed between the results of the AI system and the SIRIUS device.
6.16.2 AI system vs. physician without support
The McNemar test of the binary confusion matrix yielded P = 72.0% > 5%. Thus, no statistically significant difference existed between the results of the AI system and the physician without support.
6.16.3 AI system vs. physician with AI support
The McNemar test yielded P = 0.0% < 5%. Thus, a statistically significant difference existed between the results of the AI system and the physician with AI support.
6.16.4 AI system vs. physician with SIRIUS support
The McNemar test yielded P = 7.6% > 5%. Thus, no statistically significant difference existed between the results of the AI system and the physician with SIRIUS device support.
6.16.5 SIRIUS device vs. physician without support
The McNemar test yielded P = 50.3% > 5%. Thus, no statistically significant difference existed between the results of the SIRIUS device and the physician without support.
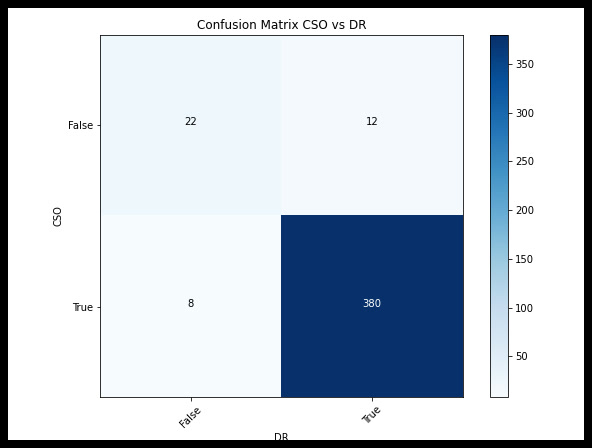
6.16.6 SIRIUS device vs. physician with AI support
The McNemar test yielded P = 0.0% < 5%. Thus, a statistically significant difference existed between the results of the SIRIUS device and the physician with AI support.
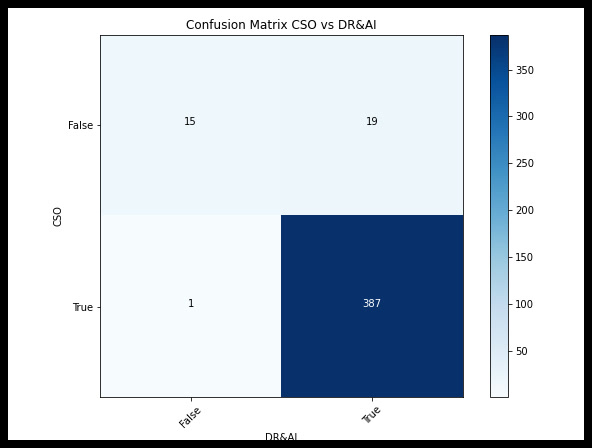
6.16.7 SIRIUS device vs. physician with SIRIUS support
The McNemar test yielded P = 0.1% < 5%. Thus, a statistically significant difference existed between the results of the SIRIUS device and the physician with SIRIUS support.
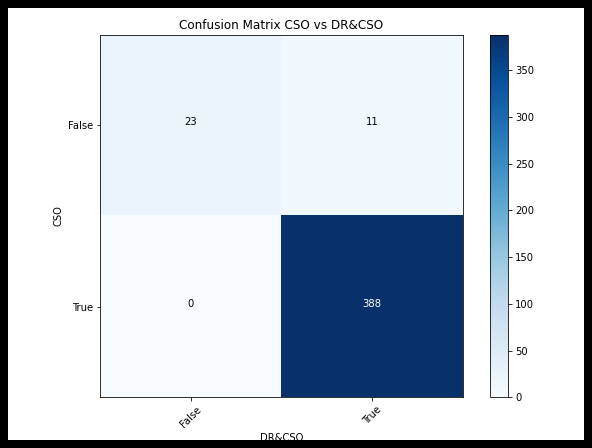
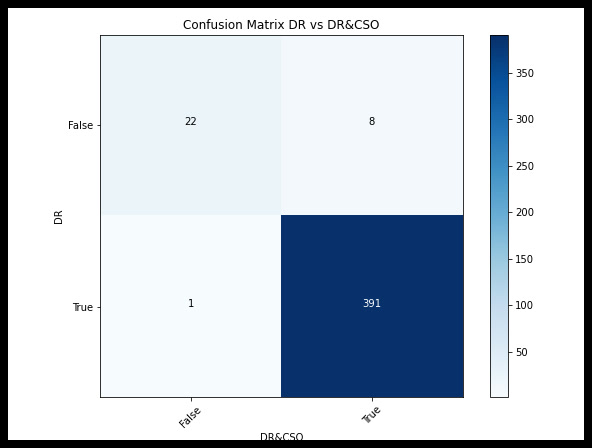
6.16.8 Physician without support vs. physician with AI support
The McNemar test yielded P = 0.0% < 5%. Thus, a statistically significant difference existed between the results of the physician without support and the physician with AI support.
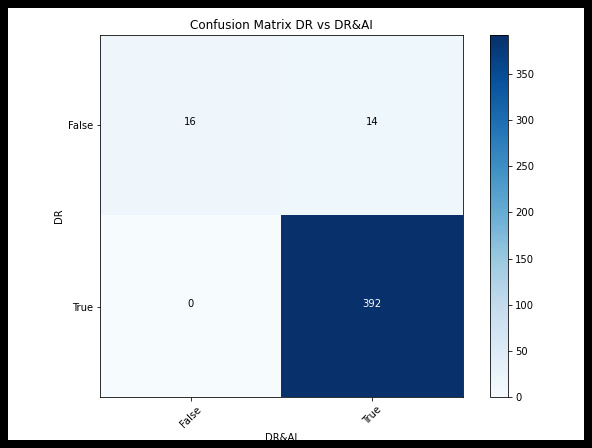
6.16.9 Physician without support vs. physician with SIRIUS support
The McNemar test yielded P = 3.9% < 5%. Thus, a statistically significant difference existed between the results of the physician without support and the physician with SIRIUS support.
6.16.10 Physician with AI support vs. physician with SIRIUS support
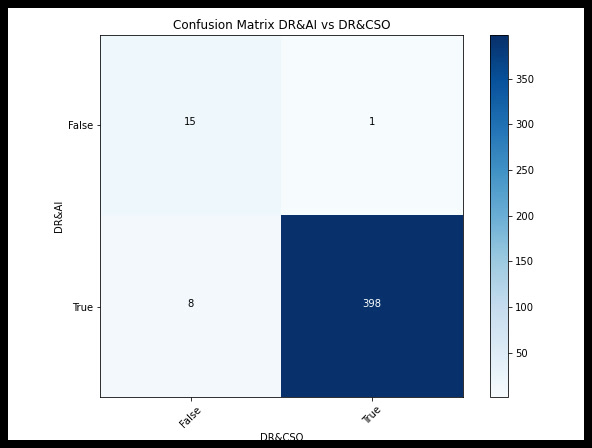
The McNemar test yielded P = 3.9% < 5%. Thus, a statistically significant difference existed between the results of the physician with AI support and the physician with SIRIUS support.
S. 158–164 – Discussion, Limitations and Conclusions
Chapter 7: Discussion
- Demographic information
- Topographic maps
- AI system and comparison with similar studies
- Comparison with other models
- Discriminative feature maps and heatmaps
- Examination of some cases
- Strengths and weaknesses of our study
7.1 Demographic information
7.1.1 Prevalence
In the training group, the high prevalence of keratoconus (30.4%) and suspect corneas (7.8%) is notable. This is because the sample was compiled from the records of a university reference hospital. Topographic examinations are usually performed in suspected cases during routine examination or for follow-up of an already diagnosed condition. Additionally, there was a researcher selection bias: for this sample, as many images as possible from all three groups were collected to train the AI system.
In the test group, the prevalence of keratoconus (4.27%) and suspect cases (13.74%) was markedly lower. This sample was randomly drawn without bias from patients with various complaints at the outpatient ophthalmology clinic and therefore better reflects reality, although its values exceed the worldwide figures of 0.0003–2.3%; the sample originates from a university reference hospital (Nikhil S. Gokhale, 2013).
7.1.2 Age distribution by diagnosis
In the training group, the mean age of suspect corneas (40.32 years) was statistically significantly higher than that of normal (31.03 years) and keratoconic corneas (30.97 years). This could be explained by some age-related changes being interpreted as suspicion signs. In the test group, this finding was not present; the difference between the mean ages of the three groups was not statistically significant (keratoconus 25.92, normal 27.02, suspect 32.11 years).
7.1.3 Sex distribution by diagnosis
Neither in the training nor in the test group was there a statistically significant difference in the distribution of males and females within the three groups. However, this is controversial in international studies: some studies found no difference in keratoconus prevalence between males and females, while others found a difference favouring males or females depending on the study (Nikhil S. Gokhale, 2013).
7.2 Topographic maps
To discuss the accuracy metrics of the topographic maps, the values were summarised by the three classes (keratoconic, normal, suspect) in three tables. Each table contains, for each metric and each group (training, validation, test), the maps with the highest values. Subsequently, the intersection of the common maps of the three groups was determined; the maps with the highest accuracy in the training group (95%) were used as the basis. The neural networks were divided into three categories (Tables 54, 55, and 56):
- Networks with high ability to confirm the diagnosis: high specificity and high positive predictive value; a positive test result confirms the diagnosis, while a negative result does not exclude it due to false negatives.
- Networks with high ability to exclude the diagnosis: high sensitivity and high negative predictive value; a negative test result excludes the diagnosis, while a positive result does not confirm it due to false positives.
- Comparison of networks for detecting positive cases: high F1-score. Accuracy was not used here due to the imbalanced groups.
7.2.1 Distinguishing definite keratoconic corneas from normal and suspect corneas
Networks with high ability to confirm: This applies to the network for the anterior tangential curvature. The changes are therefore so pronounced that they are not limited to the posterior surface but extend to the anterior surface. These local changes are best differentiated by tangential maps (Mazen M. Sinjab, 2018a).
Networks with high ability to exclude: These include the networks for the anterior and posterior elevation maps and the anterior sagittal curvature. This largely agrees with the definition used for the topographic diagnosis of keratoconus: the absence of a posterior elevation map or an anterior sagittal curvature map compatible with a keratoconic cornea argues against the diagnosis (Mazen M. Sinjab, 2018d).
Comparison of networks for positive cases: The highest value was achieved by the network for the anterior tangential curvature, followed by the posterior tangential curvature and — in this order — the networks for the posterior, anterior, and equivalent refractive power.
Table 54 – Summary of accuracy metrics of the neural networks for detecting keratoconic corneas. The abbreviations and ranking order from the source are preserved unchanged; decimal values are metrics between 0 and 1.
7.2.2 Distinguishing normal corneas from keratoconic and suspect corneas
This case is particularly important because the main objective of any metric or test is to distinguish normal from suspect and diseased cases. Recall: a map that is sensitive for the diagnosis of a normal cornea is by definition specific for the diagnosis of a keratoconic or suspect cornea; this also applies to the predictive values.
Networks with high ability to confirm: No network fulfils this condition. All networks have low specificity and low positive predictive value. Therefore, sensitivity and negative predictive value for detecting keratoconic or suspect corneas are also low; no single network can detect all cases.
Networks with high ability to exclude: These include the networks for the anterior and posterior refractive power and the anterior and posterior tangential curvature. These networks can therefore exclude the diagnosis of a normal cornea and confirm the diagnosis of a keratoconic or suspect cornea.
Comparison of networks for positive cases: The highest value was achieved by the anterior elevation map, followed by the posterior sagittal curvature, the posterior elevation map, the networks for the equivalent, anterior, and posterior refractive power; then the posterior and anterior tangential curvature. Overall, the values were close together.
Table 55 – Summary of accuracy metrics of the neural networks for detecting normal corneas.
7.2.3 Distinguishing suspect corneas from normal and keratoconic corneas
Networks with high ability to confirm: No network fulfils this condition.
Networks with high ability to exclude: No network fulfils this condition.
Comparison of networks for positive cases: A comparison is not possible.
It follows that no single network could distinguish suspect corneas from normal and keratoconic corneas. No network could extract characteristic patterns of suspect corneas. Therefore, suspect corneas appear to be a spectrum between normal and keratoconic corneas; each network will classify these corneas either as normal or as keratoconic depending on their position within this spectrum.
Table 56 – Summary of accuracy metrics of the neural networks for detecting suspect corneas.